Plot an object of class 'FKM.predicted'
plot.FKM.predicted.RdPlot an object of class 'FKM.predicted'
Usage
# S3 method for FKM.predicted
plot(
  x,
  center = TRUE,
  xmin,
  xmax,
  ntime = 100,
  lab_x,
  lab_y,
  bw = TRUE,
  title,
  title_size = 15,
  axis_label_size = 15,
  axis_title_size = 15,
  legend_label_size = 15,
  strip_label_size = 15,
  type = "raw_grid",
  ...
)
Arguments
- x
An object of class '
FKM.predicted'- center
Logical expression indicating whether trajectories are centered on individual means.
- xmin, xmax
Optional minimum and maximum values to show on x-axis.
- ntime
Optional number of times to calculate fitted values for smoothed plots.
- lab_x, lab_y
Optional labels for x- and y-axis.
- bw
Logical expression for black and white graphic.
- title
Optional title.
- title_size
Optional title size.
- axis_label_size
Optional size of axis labels.
- axis_title_size
Optional size for axis titles.
- legend_label_size
Optional size for legend.
- strip_label_size
Optional size for strip labels on graphics.
- type
Type of plot to produce. Options are
"raw","raw_grid","smooth", and"smooth_grid".- ...
Additional arguments
Examples
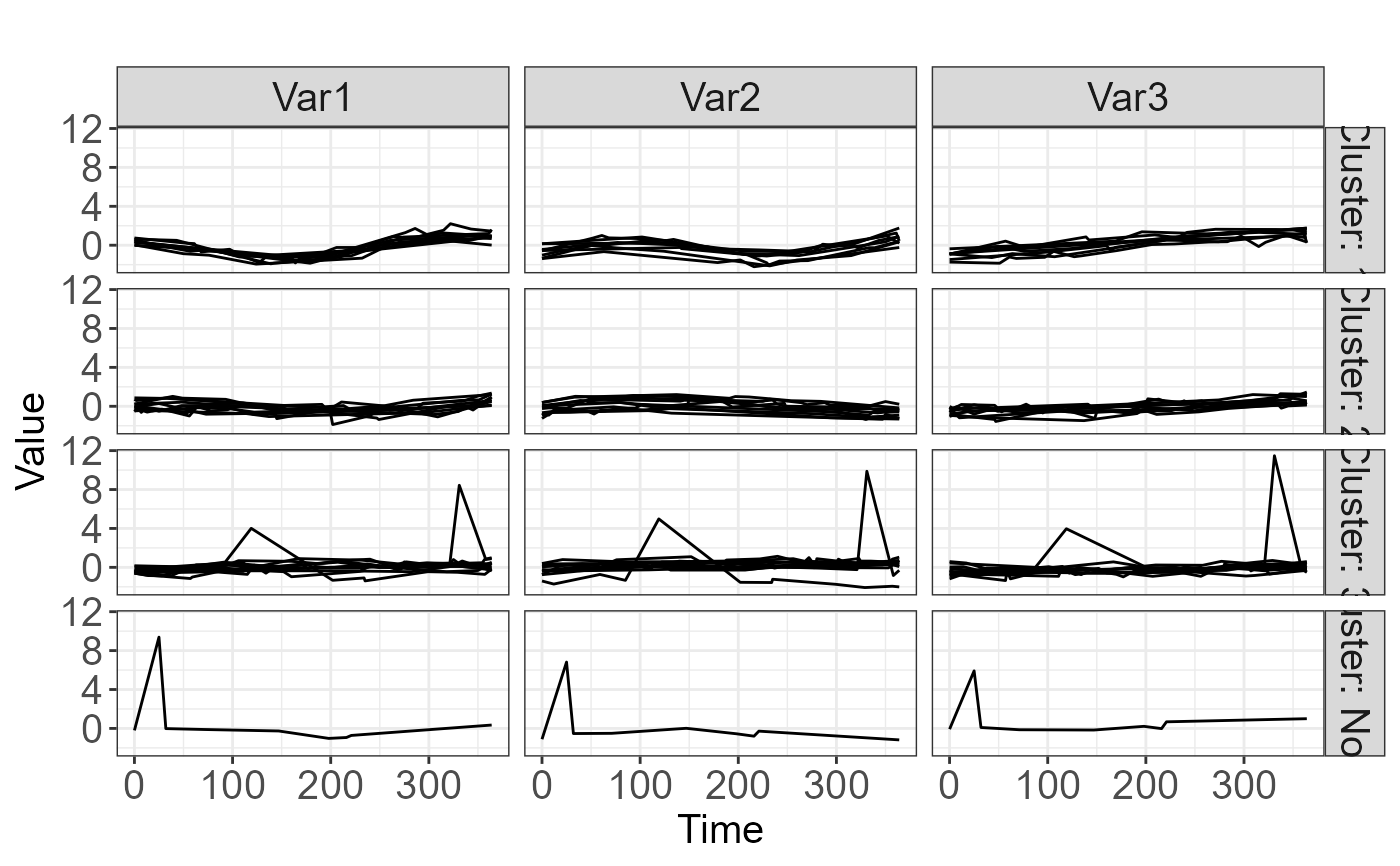
data(TS.sim)

fitsplines <- TPSfit(TS.sim, vars=c("Var1", "Var2", "Var3"), time="Time",
     ID="SubjectID", knots_time=c(0, 91, 182, 273, 365), n_fit_times=10)

clusters1 <- cluster.fitted(fitsplines, k=3, m=1.3, seed=12345, RS=5, noise=TRUE)

predicted_clusters <- predict(clusters1, TS.sim.new)
plot(predicted_clusters, label_size=10, type="raw_grid")