Plot an object of class 'FKM.TPS'
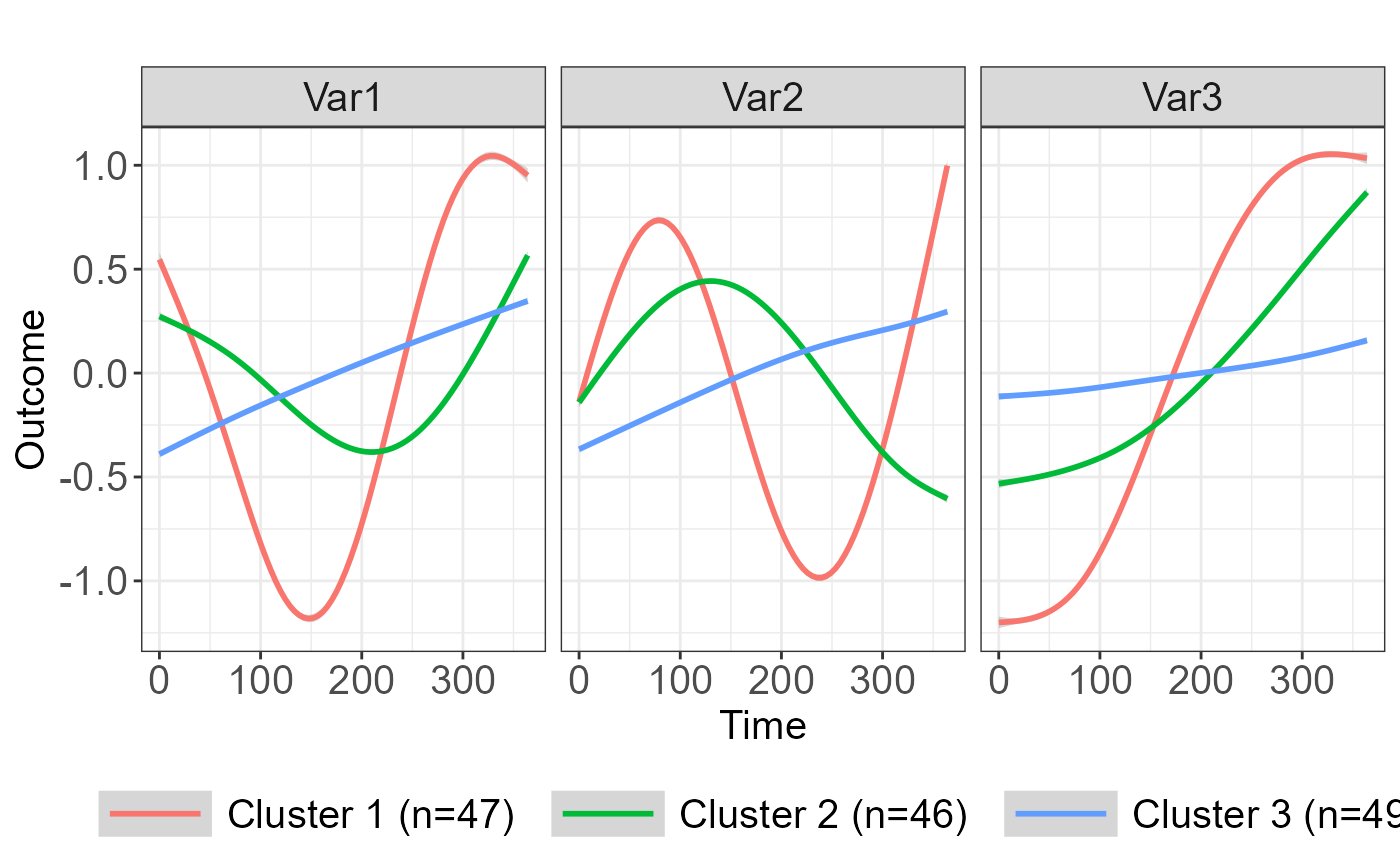
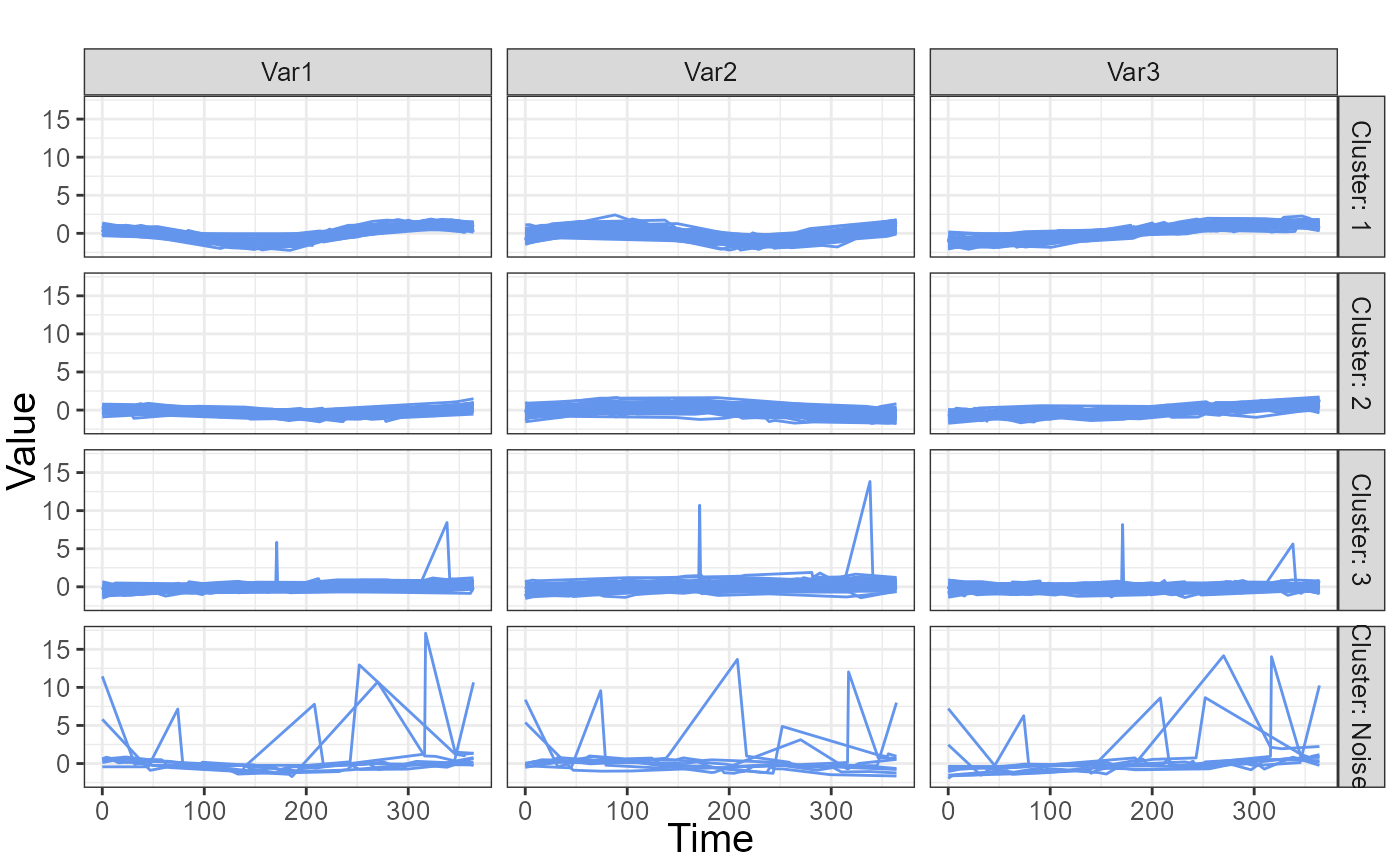
plot.FKM.TPS.RdProduces a number of plots for an object of class FKM.TPS using ggplot2::ggplot(). Possible plots include mean trajectory by cluster, spaghetti plot of raw data by cluster overlaid or in grid format, and smoothed spaghetti plot by cluster overlaid or in grid format.
Usage
# S3 method for FKM.TPS
plot(
  x,
  center = TRUE,
  xmin,
  xmax,
  ntime = 100,
  lab_x,
  lab_y,
  bw = FALSE,
  title,
  title_size = 15,
  axis_label_size = 15,
  axis_title_size = 15,
  legend_label_size = 15,
  strip_label_size = 15,
  type = "mean",
  ...
)
Arguments
- x
A object of class '
FKM.TPS' output fromcluster.fitted()orcluster.coefs()- center
Logical expression indicating whether to center trajectories on individual means.
- xmin, xmax
Optional minimum and maximum values to show on x-axis.
- ntime
Optional number of times to calculate fitted values for smoothed plots.
- lab_x, lab_y
Optional labels for x- and y-axis.
- bw
Logical expression for black and white graphic.
- title
Optional title.
- title_size
Optional title size.
- axis_label_size
Optional size of axis labels.
- axis_title_size
Optional size for axis titles.
- legend_label_size
Optional size for legend.
- strip_label_size
Optional size for strip labels on graphics.
- type
Type of plot to produce. Options are
"mean","smooth","smooth_grid","raw","raw_grid", and"all".- ...
Additional arguments
Examples
data(TS.sim)

fitsplines <- TPSfit(TS.sim, vars=c("Var1", "Var2", "Var3"), time="Time",
     ID="SubjectID", knots_time=c(0, 91, 182, 273, 365), n_fit_times=10)

clusters1 <- cluster.fitted(fitsplines, k=3, m=1.3, seed=12345, RS=5, noise=TRUE)
plot(clusters1, type="raw_grid", strip_label_size=10, axis_label_size=10)

plot(clusters1, type="mean", legend_label_size=15, lab_y="Outcome")
#> `geom_smooth()` using method = 'gam' and formula 'y ~ s(x, bs = "cs")'
plot(clusters1, type="mean", legend_label_size=15, lab_y="Outcome")
#> `geom_smooth()` using method = 'gam' and formula 'y ~ s(x, bs = "cs")'